An analysis of GvG event
Summary of GvG event
A kind of Guild VS Guild event.
Last period 2014-10-09 ~ 2014-10-16. 12:00:00 ~ 12:59:59, 22:00:00 ~ 22:59:59 twice everyday.
Average access user is about 4000. Access is concentrated in one hour, so the load was heavy.
There’re 4 web servers to handle the access, DB is one master, one slave.
There’s a serious bug in the initial versions so the load average is crazily high. In about 10-12, we fixed the bugs so the performace after 10-12 is more reiable.
The bug
SELECT last_insert_id()
VS
SELECT last_insert_id() FROM xxx
The former will return the id of last inserted record, while the latter will return last inserted id for EVERY RECORD in the table, which blowed up our application.
Before
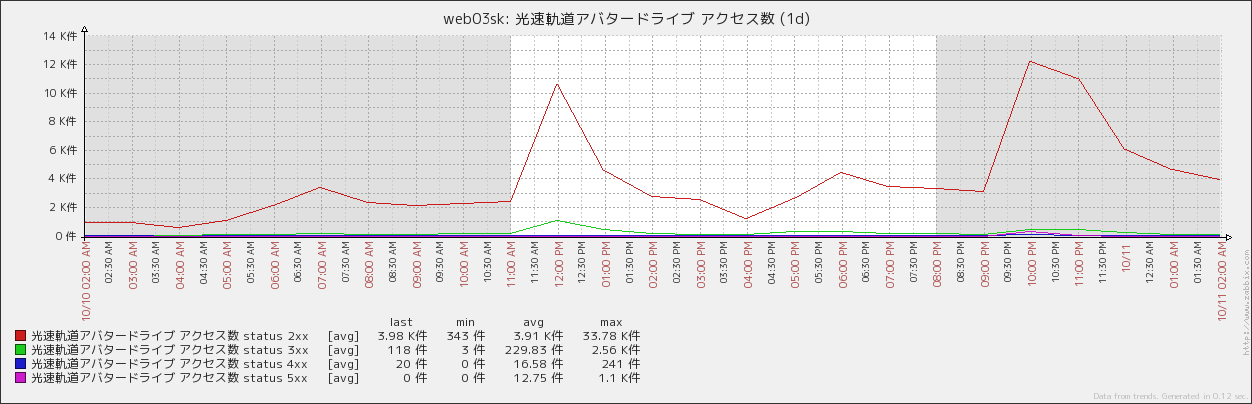
- number of access per sec:
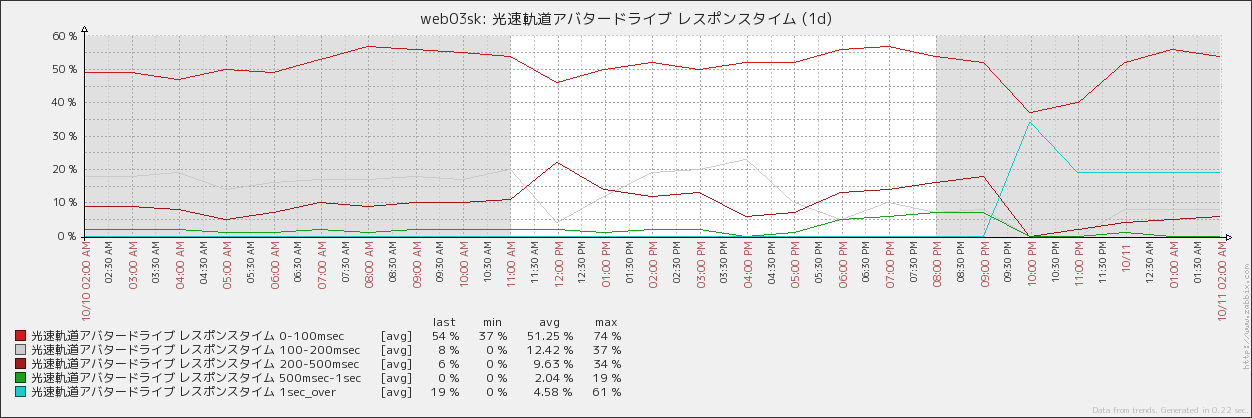
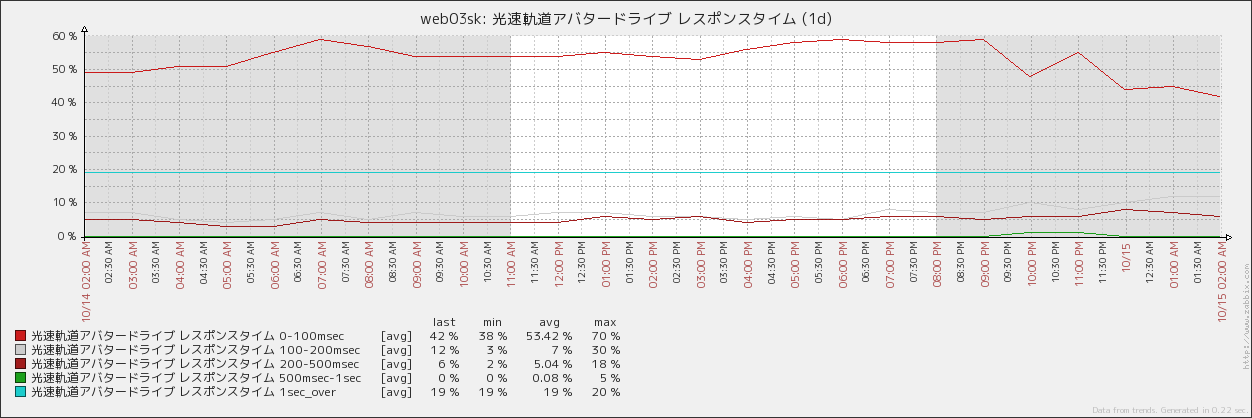
- response time:
- cpu load average:
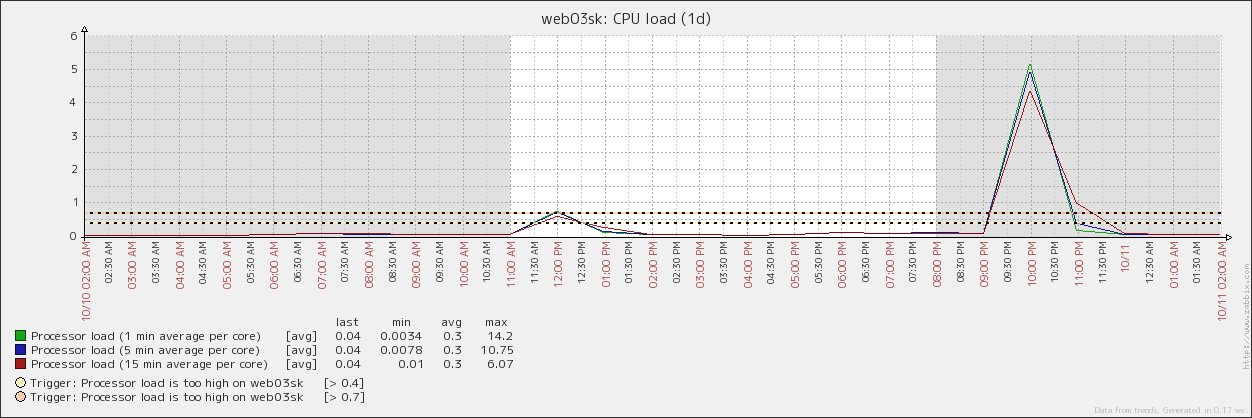
Response slows as requests increase. Also we can see that, because of the slow query the cpu load reaches as high as 5 at peak time.
After fix
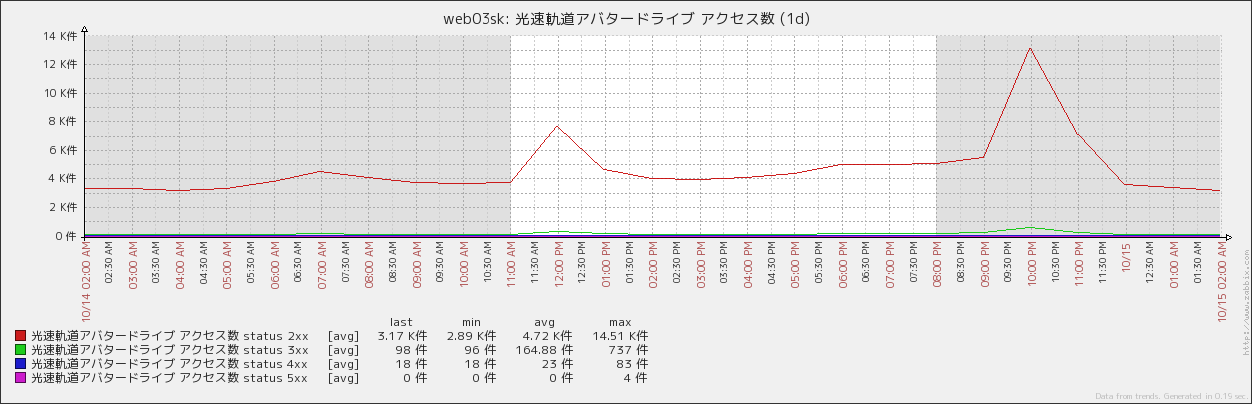
- number of access per sec:
- response time:
- cpu load average:
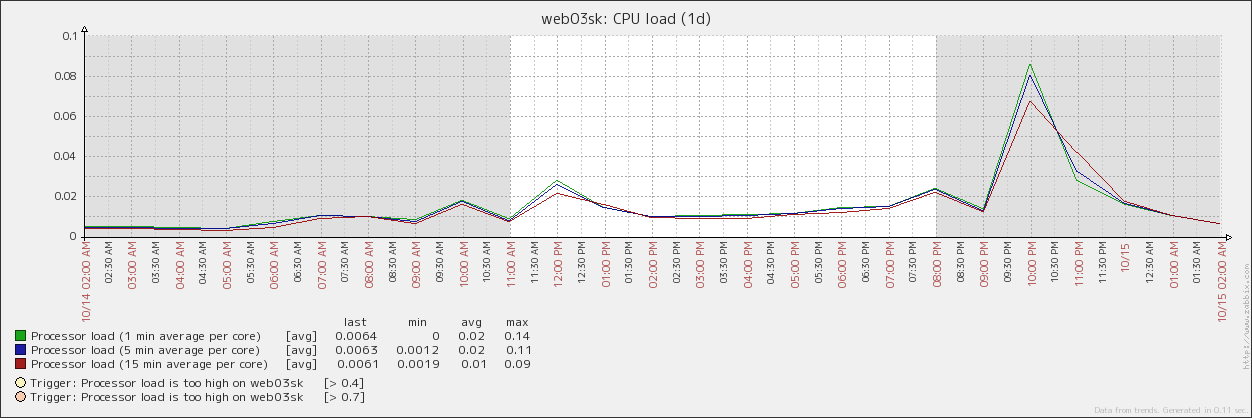
After the bug is fixed, the load average returns to a reasonable level.
Some Addtional Figures
- QPS
At peak time, the master has qps of about 3k, among the operations, select operation consists 60% which is about 2k qps, while update and insert is 300 and 500 respectively.
- Response Time
0 ~ 100ms is mostly access time of static files. 100 ~ 200ms is considered as “Good” response time. When response time reaches 200ms or more, the request should be especially pay attention to, because they will surely kill the game if come to frequently.